Note: Note: NY NGMS will focus on the " Sample Standard Deviation".
 Standard Deviation Standard Deviation |
Standard deviation helps determine how closely data is clustered around the mean value.

|
Standard deviation shows how much variation (dispersion, spread, scatter) from the mean exists. It represents a "typical" deviation from the mean. |
|
The standard deviation can be thought of as a "standard" way of knowing what is normal (typical), what is very large, and what is very small in the data set.
It is the average amount that data values deviate from the mean value of the data.
If the standard deviation is low (a small number), the data will be clustered close to the mean.
If the standard deviation is high (a large number), the data is spread over a large range of values.
Standard deviation is a popular measure of variability because it returns the original units of measure of the data set. For example, original data containing lengths measured in feet has a standard deviation also measured in feet.
NOTATIONS: Standard deviation may be abbreviated SD or sd.
Mathematically speaking, it is represented by
• the lower case Greet letter
σ (sigma) for population sd.
• and the Latin letter S for sample sd.

 |
Most data in a data set falls within one standard deviation of the mean of that set.
|
Standard deviation is a common way to describe the amount of variability in a set of data.
The typical range of the variability, as determined by the standard deviation,
can be seen graphically.
In general, when standard deviation is calculated, it is found that
•
approximately 68% of the data will fall within one standard deviation of the mean,
•
approximately 95% of the data will fall within two standard deviations of the mean,
•
approximately 99.7% of the data will fall within three standard deviations of the mean.
Standard deviation can be thought of as the variation on either side of the mean value of the data set
(above or below the mean).
For typical populations, the mean will reside in the center of the graph, and be a maximum turning point of the graph. The amount of data falling into the 1st, 2nd and 3rd standard deviation, σ, categories will be displayed to the left and right of the mean. |
Normal Curve Empirical Rule: 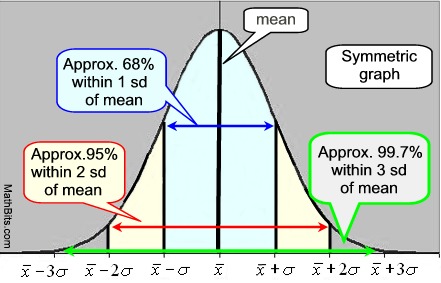 |
The typical graph showing the standard deviation in relation to the mean
is a symmetrical graph known as a normal curve or the "bell" curve.
Remember: Most data falls within one standard deviation of the mean.
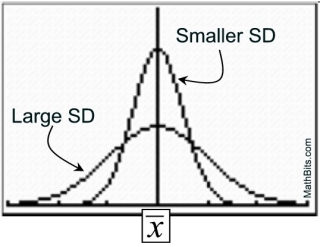
The center of the graph is the mean, and the height and width of the graph are determined by the mean and the standard deviation of the data.
The mean and median have the
same values in a normal curve. |
The mean,  , determines the line of symmetry of the graph, and the standard deviation, SD, determines how much the data are spread out. , determines the line of symmetry of the graph, and the standard deviation, SD, determines how much the data are spread out.
• When the standard deviation is small, the curve will be tall and narrow in spread (clustered).
•
When the standard deviation is large, the curve will be short and wide in spread.
NOTE: IQR for a normal curve is
1.34896 x standard deviation.
|
 |
| Thinking About Standard Deviation |
If you know that the mean on the last math test was 83 and that the standard deviation was 0, what do you know about the test scores?
The weights of 5 cats, in pounds, are 8, 10, 11, 13, 15, and you are told that the sample standard deviation is 2.7.
a) What is the mean weight?
b) What would be a weight of 2 SD above the mean?
c) What would be a weight of 1 SD below the mean?
Ex 1 - ANS: Everyone got the same score of 83.
Ex 2 - ANS: a) 11.4 b) 11.4 + 2(2.7) = 16.8 lbs. c) 11.4 - 1(2.7) = 8.7 lbs.
See Calculating Standard Deviation
for calculator skills, formulas and by hand calculations.
|